Visualization Workspace
Each component of this workspace can be found in each imagery workspace:
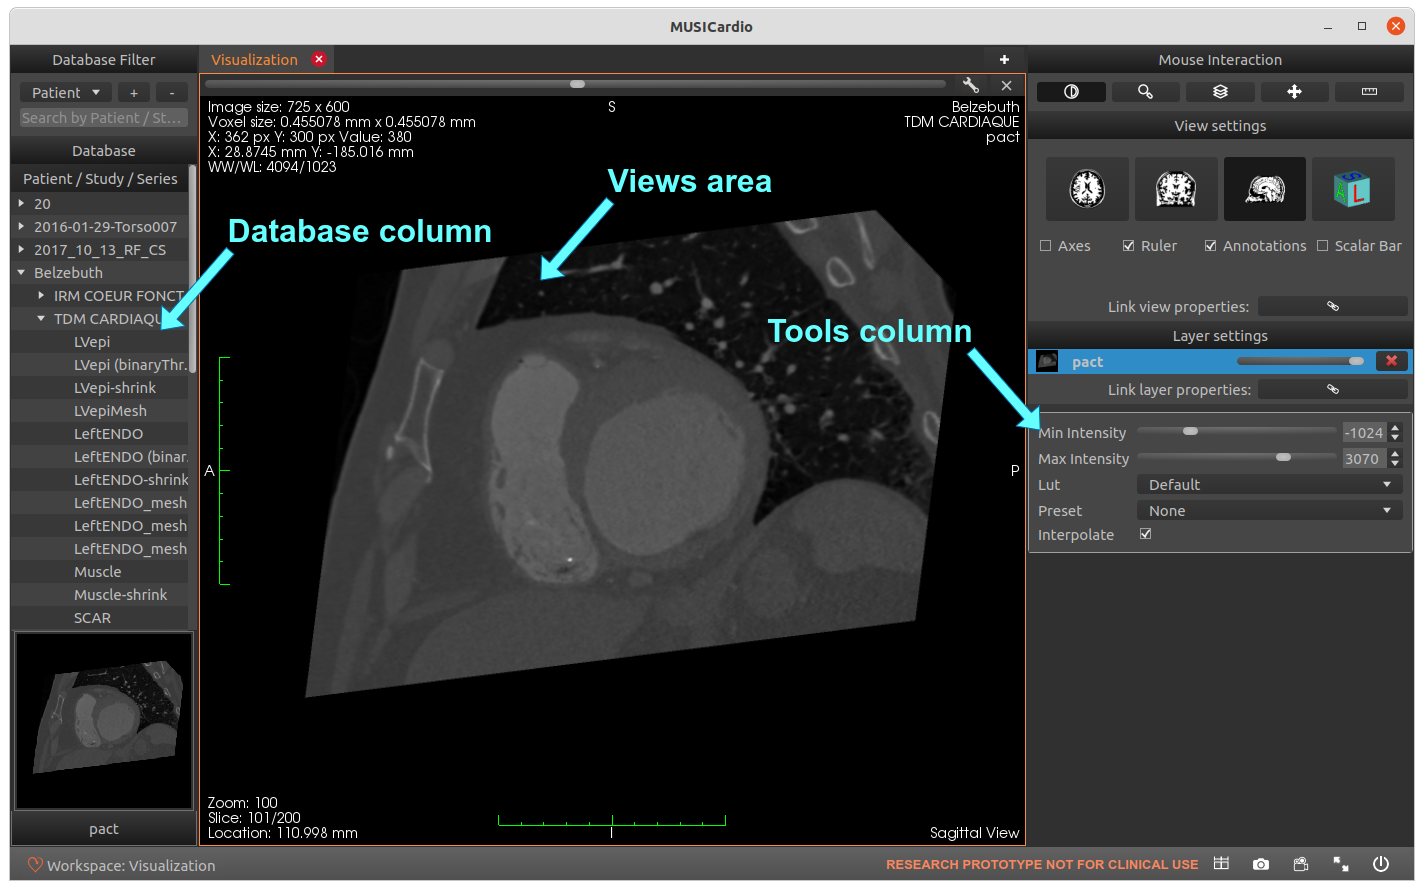
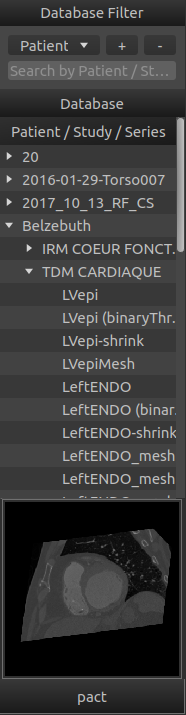
Example of database usage
Components
The components of the database area are:
Database Filter
A filtering area at the top of this column to select easily your patient/data.
Database Tree
Data in italics are temporary imported, they will be removed at the closing of the application.
Save them to keep them in the database.
A database tree to retrieve your data:
- Double-click on a data, or drop it on the view area to display it.
- Right-click to export, remove, view, or display the list of metadata of the selected data. You can also permanently save a temporary data with "Save".
Thumbnail
A thumbnail area to display a small image of the current data selected in the database.
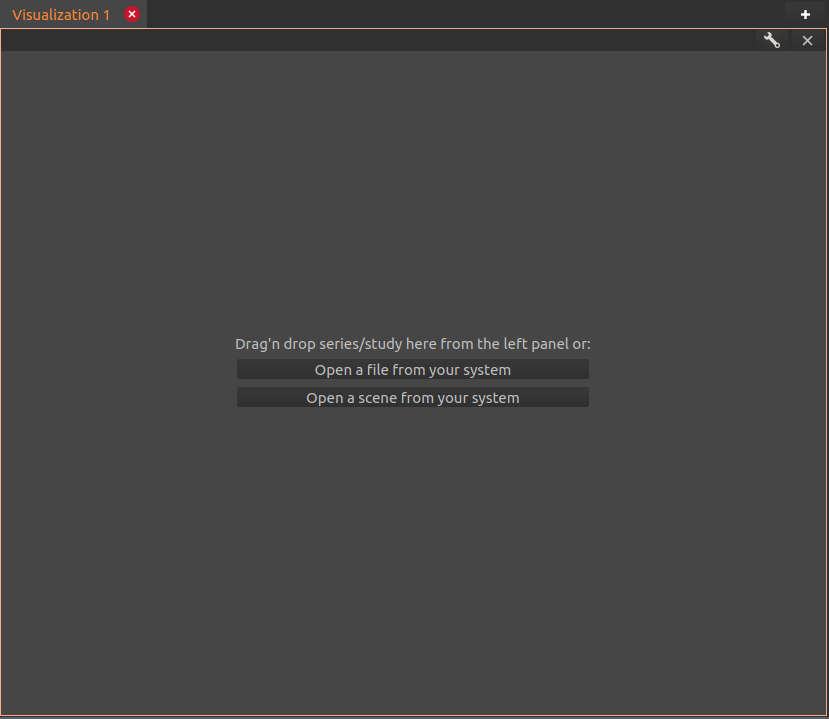
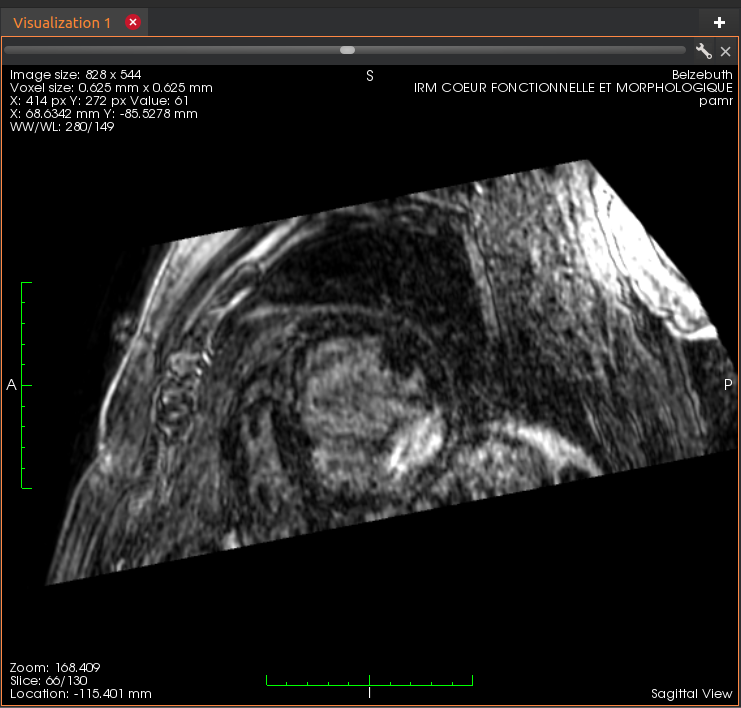
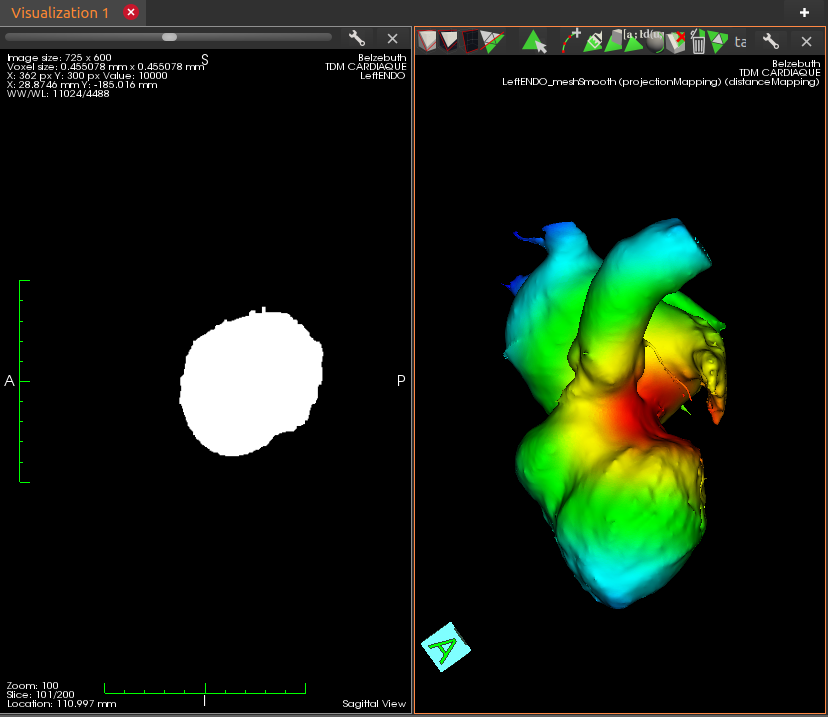
Example of views usage
Components
The components of the views area are:
A View site
To display your data.
A Tab bar
Above the view. You can add tabs (Ctrl+T or "+"), move, or remove (Ctrl+W or "x").
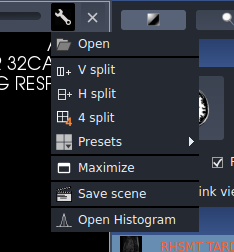
A "Tools" button
Use the button to open data, split the view, maximize a view, save a scene, display an histogram, etc.
Opening buttons
In an empty view, 2 buttons to open regular data (mha, vtk, etc) or Scenes.
Scenes
A scene is a snapshot of what's inside your current view. It records the position of the camera as well as the rendering parameters of each layer displayed in the view, such as its current attributes, LUT, dynamic range, or opacity.
- Save a scene: in your current view, use the "Tools" button: "Save scene" and choose a directory where the scene is going to be saved.
- Load a scene: you can load your data by clicking the 2nd button in the middle of your empty view "Open a scene from your system". Select the globalMapping.xml file of your scene.
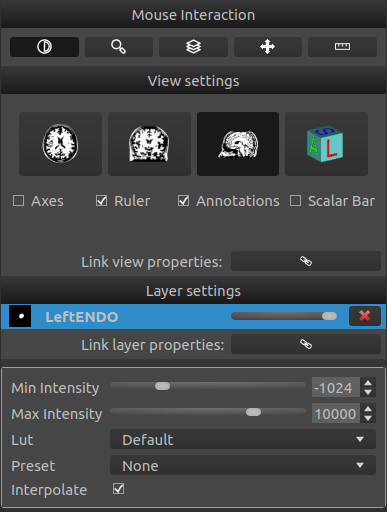
The tools column includes only settings tools in the Visualization workspace. In the other imagery workspaces, you will find also dedicated toolboxes.
Mouse interaction
Where you can manage some attributes as:
- zooming: used to zoom in/out the image.
- slicing: used to change the displayed slice.
- windowing: contrast/brightness, control the window width/level of the look-up table (not on mesh).
- panning: move the position of the data in the view.
- measuring: activates a millimeters-ruler tool between two selected points in the view.
View settings
To switch the orientation of your displayed data: Axial, Coronal, Sagittal and 3D.
Several rendering 3D modes are proposed for non-mesh volumes.
This tool allows also to hide/show axes, ruler, annotations
and a scalar bar on your current view.
Layer settings
Displays a list of the layers of the view.
You can hide/show a layer by clicking on its thumbnail and change the opacity by moving the
slider.
Below:
- if your current data is a volume, you can change the minimum and maximum intensity value, Lut and preset of your data.
- if your current data is a mesh, you can change the rendering mode (WireFrame, Surface, Points / no edge), color, and attributes of your data.
Link properties
To continue the tutorial:
- You can now learn more about the workspaces and toolboxes in MUSICardio with the Workspaces menu.
- Feel free to read the other menu pages giving information about tools in the software, or the way to use MUSICardio.